You can find in the directus docs a good documentation how to run a build of directus in docker. For developing and contributing to direcuts itself there is a good documentation on running directus locally.
But if you want to develop a directus endpoint extension locally, you might want to use the "breakpoint" feature of your IDE (e.g. vscode). Without the need to run the entire directus stack with pnpm in development mode.
I figured a setup which works pretty good for me by using the npm package dependency. First of all, create a new project for directus.
A very simple npm init will do the trick:
$ mkdir my-test
$ cd my-test
$ npm init
package name: (my-test)
Now add the required directus version (e.g. 10.5.3) as dependency via npm install --save
$ npm install --save 'directus@^10.5.3'Add a start and init command to package.json:
{
  "name": "my-test",
  "scripts": {
    "start": "directus start",
    "init": "directus init"
  },
  "dependencies": {
    "directus": "^10.5.3",
    "sqlite3": "^5.1.6"
  }
}
Initialize the .env file by running:
$ npm run init

> init
> directus init

? Choose your database client SQLite
? Database File Path: ./data.db

Create your first admin user:

? Email [email protected]
? Password ********

Your project has been created at ~/workspaces/my-test.

The configuration can be found in ~/workspaces/my-test/.env
Your package.json will be extended by the database driver (e.g. sqlite3 in my case).
To ensure that your extensions are reloaded (as soon as they changed), change the .env line from:
EXTENSIONS_AUTO_RELOAD=falseto
EXTENSIONS_AUTO_RELOAD=trueNow start the instance like this:
$ npm run startLet's add a (very very) simple endpoint to show how debugging works. Create the folder extensions/endpoints/metrics and the file index.mjs in there with the contents:
// extensions/endpoints/metrics/index.mjs
export default {
	id: "metrics",
	handler: (router, { services, database, getSchema, env, logger, emitter }) => {
		let {MetaService, CollectionsService} = services;

		router.get('/', async (req, res, next) => {

			let metaService = new MetaService({knex: database, schema: req.schema, accountability: {admin: true}});
			let collectionsService = new CollectionsService({knex: database, schema: req.schema, accountability: {admin: true}});

			let statistics = {
				"collections": []
			}

			statistics.collections = await Promise.all((await collectionsService.readByQuery()).map(async (collection) => {
				return {
					"name": collection.meta.collection,
					"size": await metaService.totalCount(collection.meta.collection),
				};
			}));

			res.json(statistics);
		});
	},
};
If you now use vscode to run npm run start, put a breakpoint at the let statistics line and open http://0.0.0.0:8055/metrics in your browser
you will see the breakpoint stopping right there:
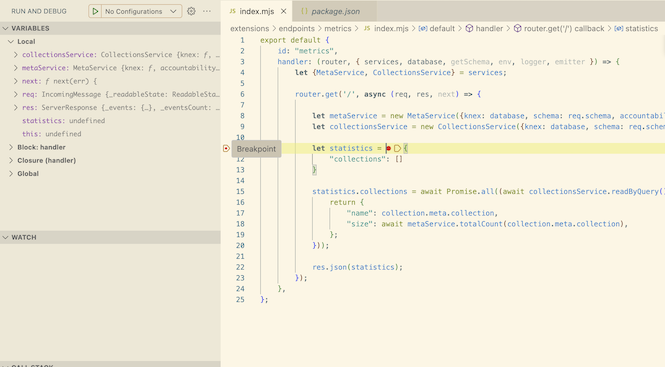
That's it.


